Your research has a story. Let’s draw it out.
Through expressive, collaborative sketching, I transform research findings, SME insights, and user journeys into story-driven visuals that feel more like a graphic novel than a spreadsheet
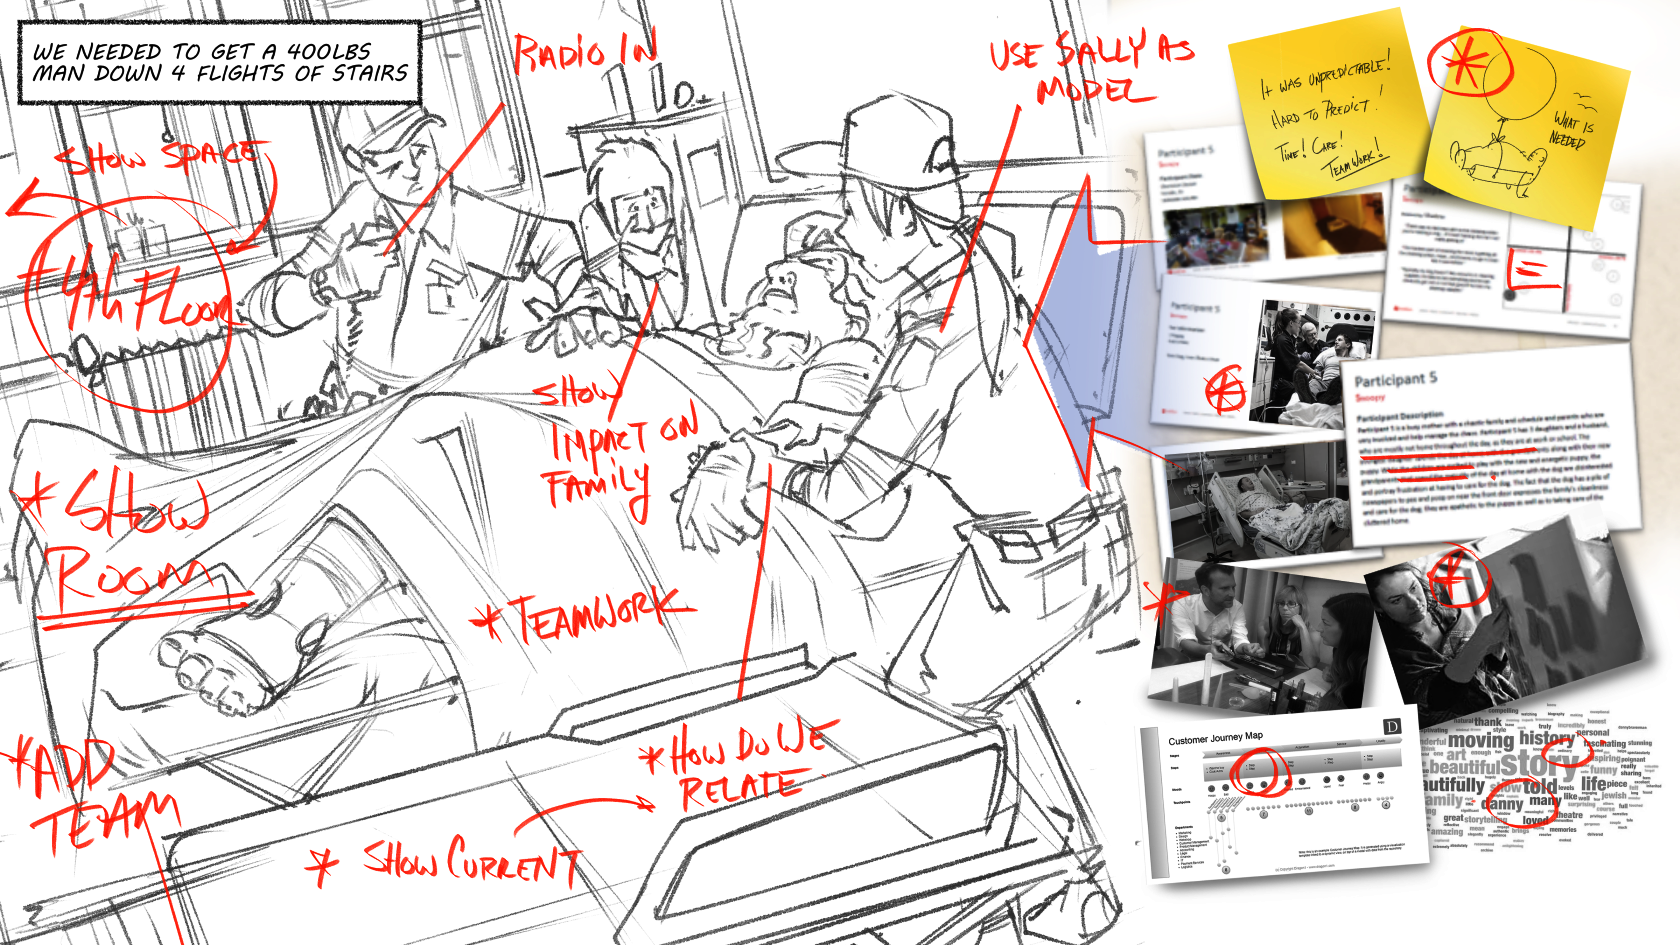
Too often, insights from interviews, research, and user experience work die in decks no one reads. And journey maps? They’re usually flat, forgettable, and ignored."

"Without emotional engagement and visual clarity, even good ideas fade. My maps fix that by combining story, design, and strategy into one visual language your team can feel and use.


One Sketch, Many Stories: Research, Insight, and Experience, Visualized”
Turn raw research and interview data into visual, emotional narratives
Make SME insights tangible and usable across functions
Bring customer journeys to life with drama, empathy, and resolution
Engage cross-functional teams with shared visuals and vocabulary that spark action
"I bring design and storytelling experience from the product world—and an artist’s eye from the entertainment world. I treat each journey map like a storyboard: expressive characters, emotional turning points, and tight composition."
"This is a collaborative, iterative sketch process where we co-create the visuals and the language together—refining as we go. Like the best picture books, each element adds meaning: the drawings reveal what the words can’t, and vice versa."
“We Sketch. We Iterate. We Tell the Whole Story.”
Listen First – We extract emotional highs and lows from research, SME interviews, or journey data
Sketch Together – Through live iterations, we build visual storyboards and refine language side-by-side
Draw the Vision – We create a final map that’s clear, emotional, and presentation-ready
John Bleau Creative helps research, product, and strategy teams visualize what they’re hearing. Whether it’s customer interviews, internal SME insight, or UX journey data, John works collaboratively to turn insights into highly visual, emotionally charged maps that reveal patterns, highlight friction, and tell a cohesive story. These maps blend verbal and visual narratives for maximum clarity and impact.
Visual Showcase
Headline:
“See the Emotion Behind the Data”
Include snippets of sketch panels that cover:
A customer frustration moment
A powerful quote from an SME
A research insight turned into a visual metaphor
Caption: “Insights are only useful if people remember them. That’s why we draw them.”
Lead Magnet (Optional)
Title:
“Sketching Insight: A Guide to Turning Research into Visual Stories”
Includes:
3 types of insights perfect for sketch mapping
Side-by-side: dry vs. story-driven visualizations
The sketch + text pairing model used in comics and picture books
[ Download the Guide ]